Creepypasta Infographic
Poster
Goal
Although we had free-range on what we wanted to do this project on, the goal was clear: choose a topic to track data on, collect your data, and visualize it on a 16”x20” poster.
Decision and Solution
As a fan of light horror, and with October approaching, I decided to do my data collection on Creepypasta stories.
For those unfamiliar, Creepypasta stories are Internet horror stories that are easy to share online, and usually copy-pasted across multiple platforms. They're all fictional, even if they present themselves as true. You can read them on creepypasta.com and find out more about them on creepypastafiles.fandom.com, but beware if you scare easily.
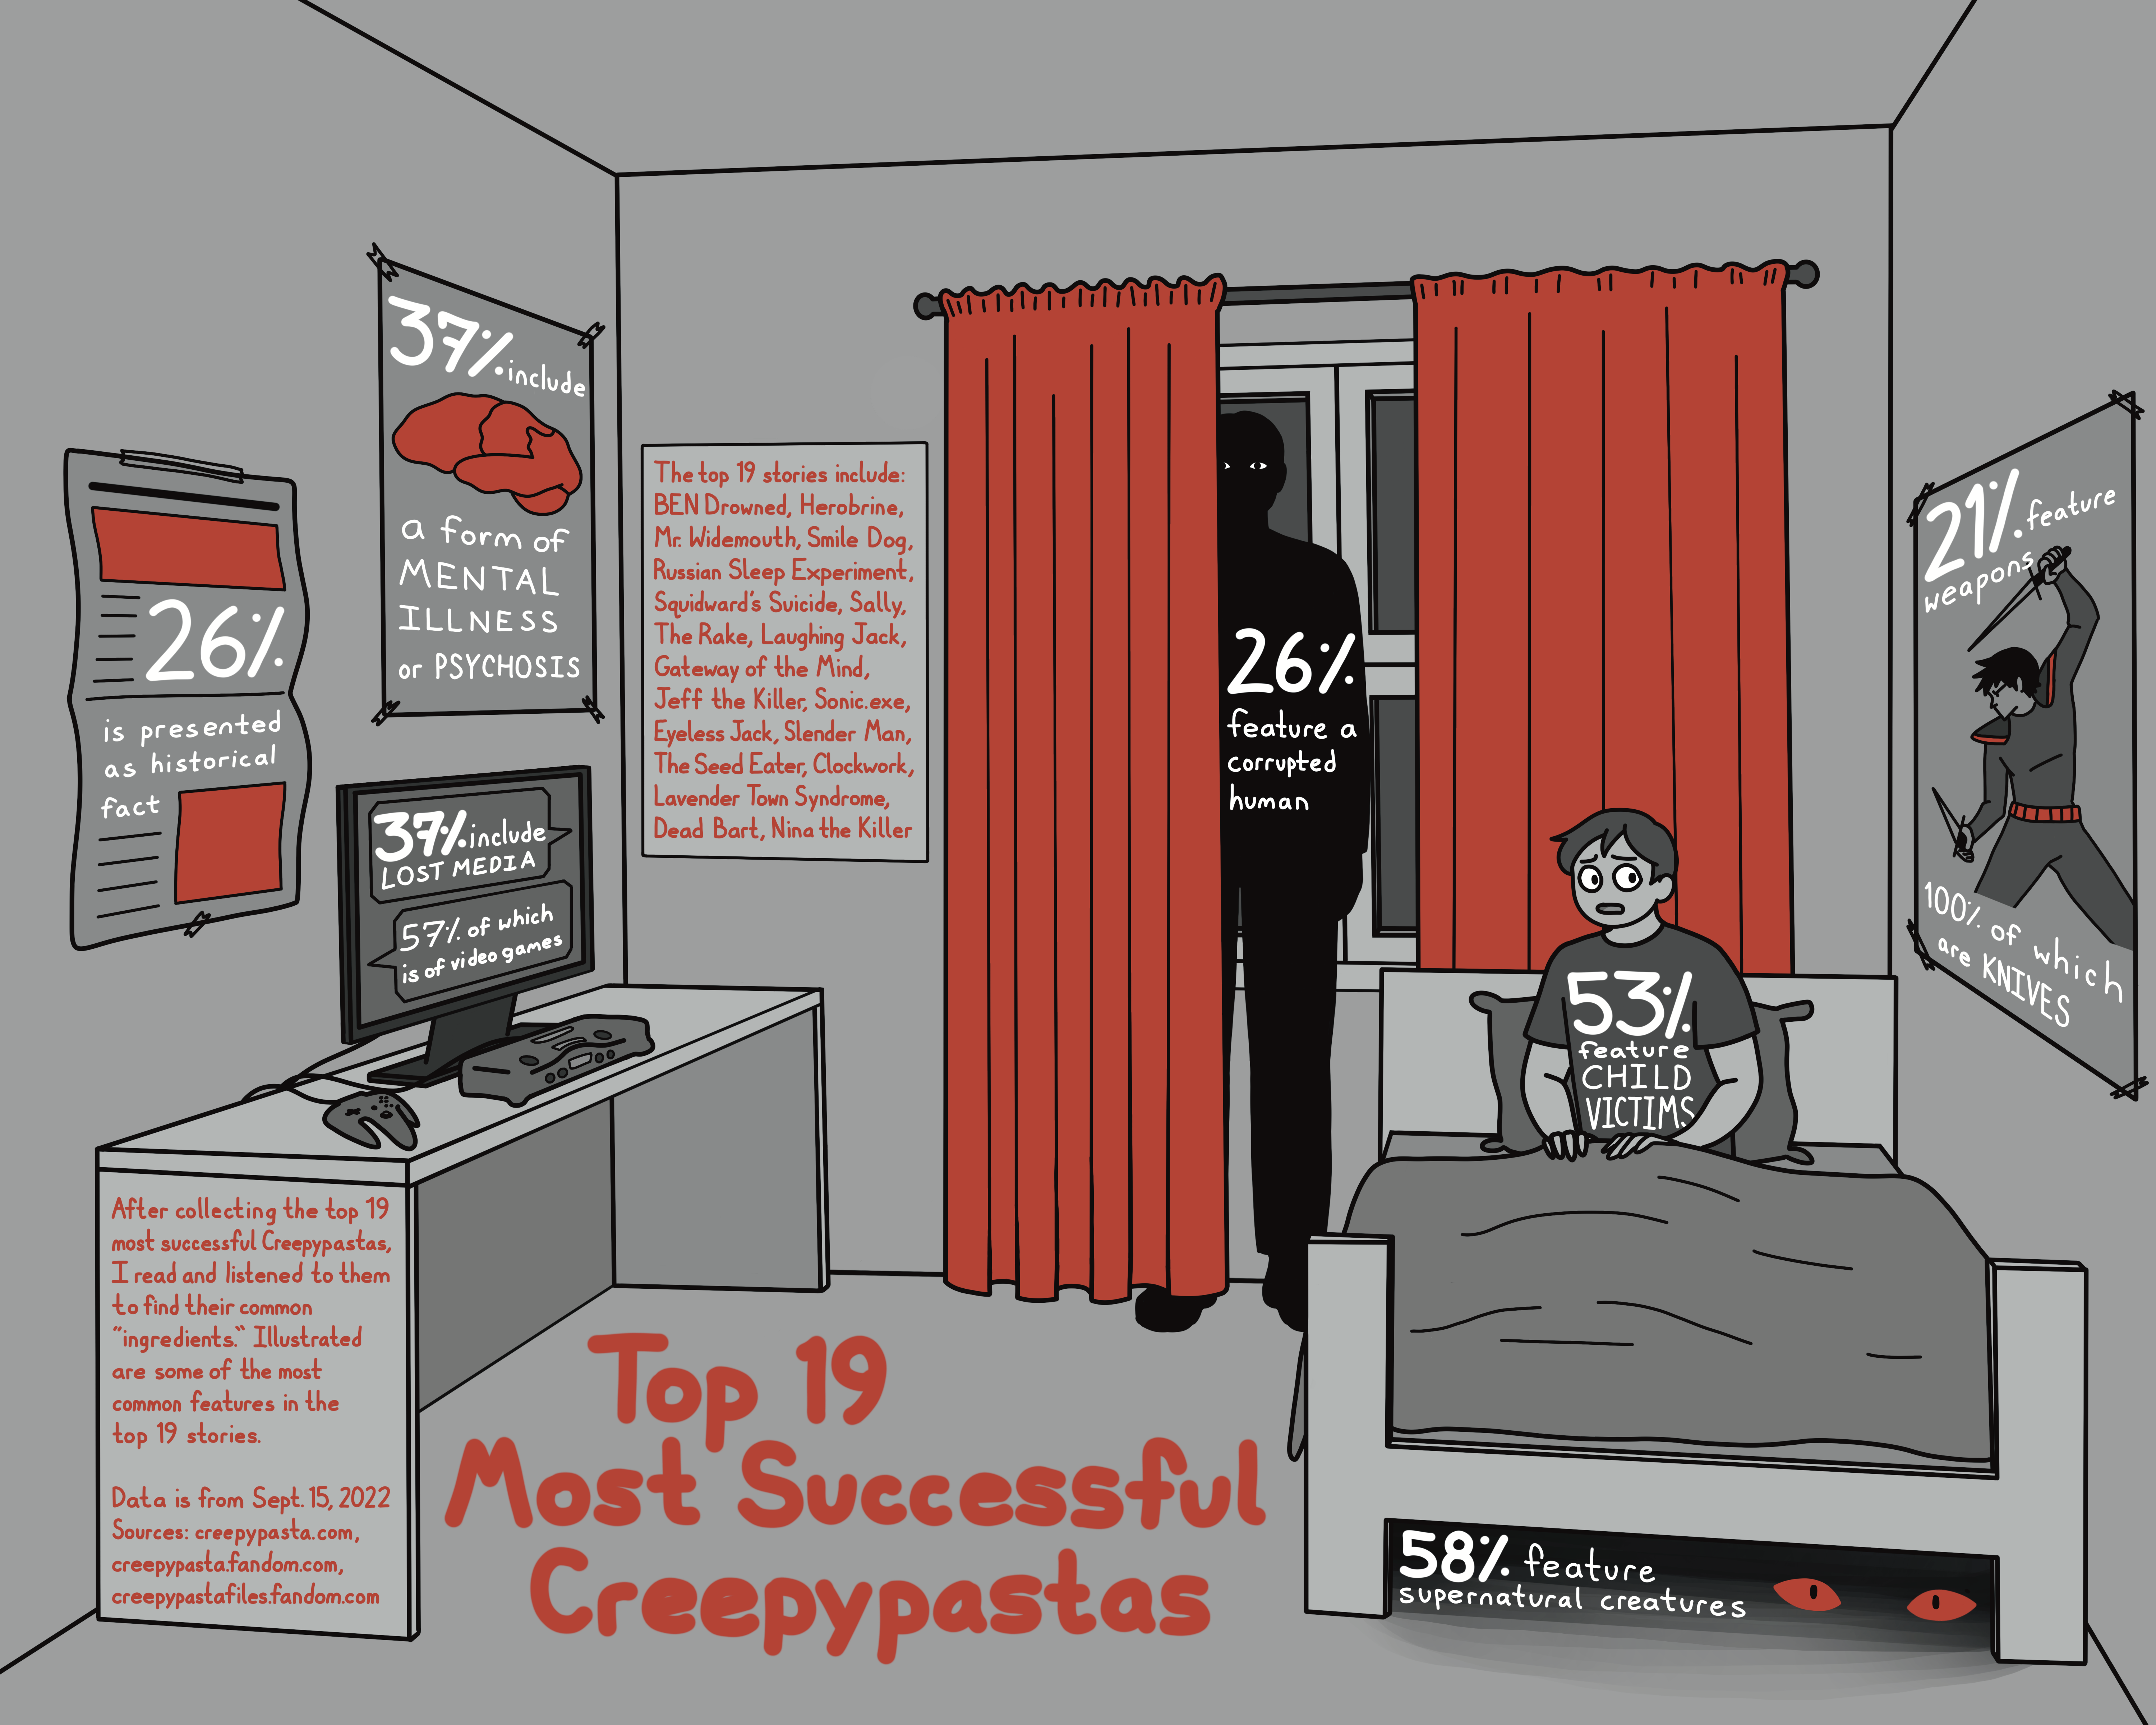
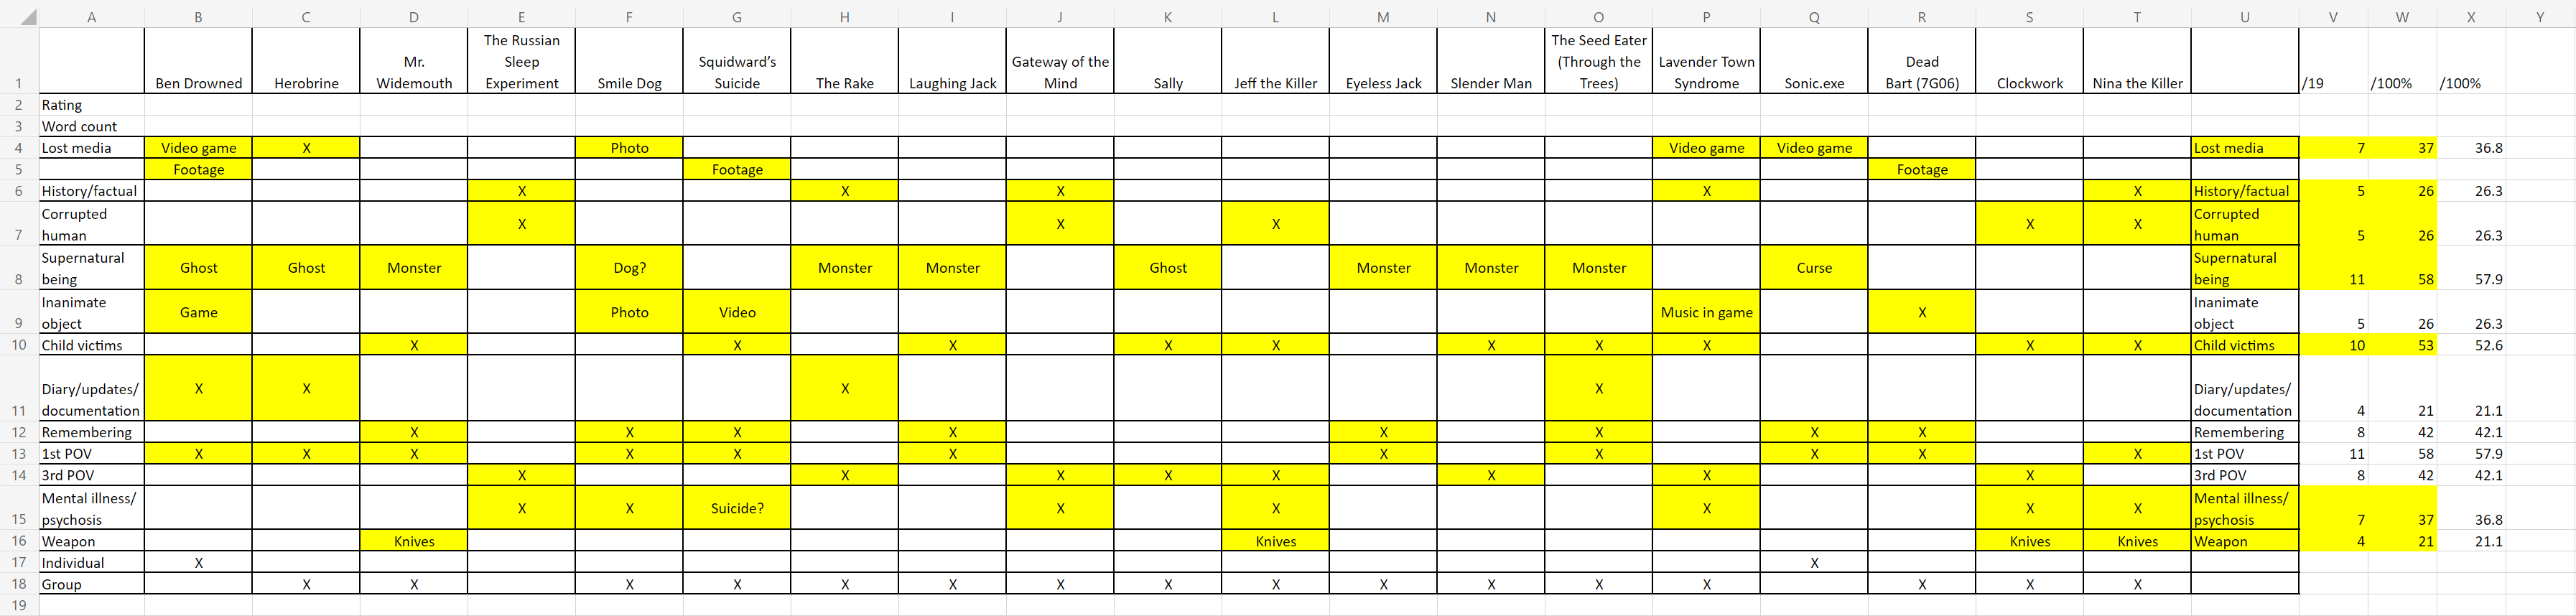
Creepypastas have consistent “ingredients” in many of the stories, so I decided to “track” them. Since there are now thousands of stories, I decided to only look at the top 19 rated and most talked-about stories. I took note of the titles and ratings, and got to work on the research. I read and listened to all 19 stories, and took notes on what they contained: murder, lost media, monsters, children, and so on. I then quantified the data into fractions and percentages, and was ready to start designing.
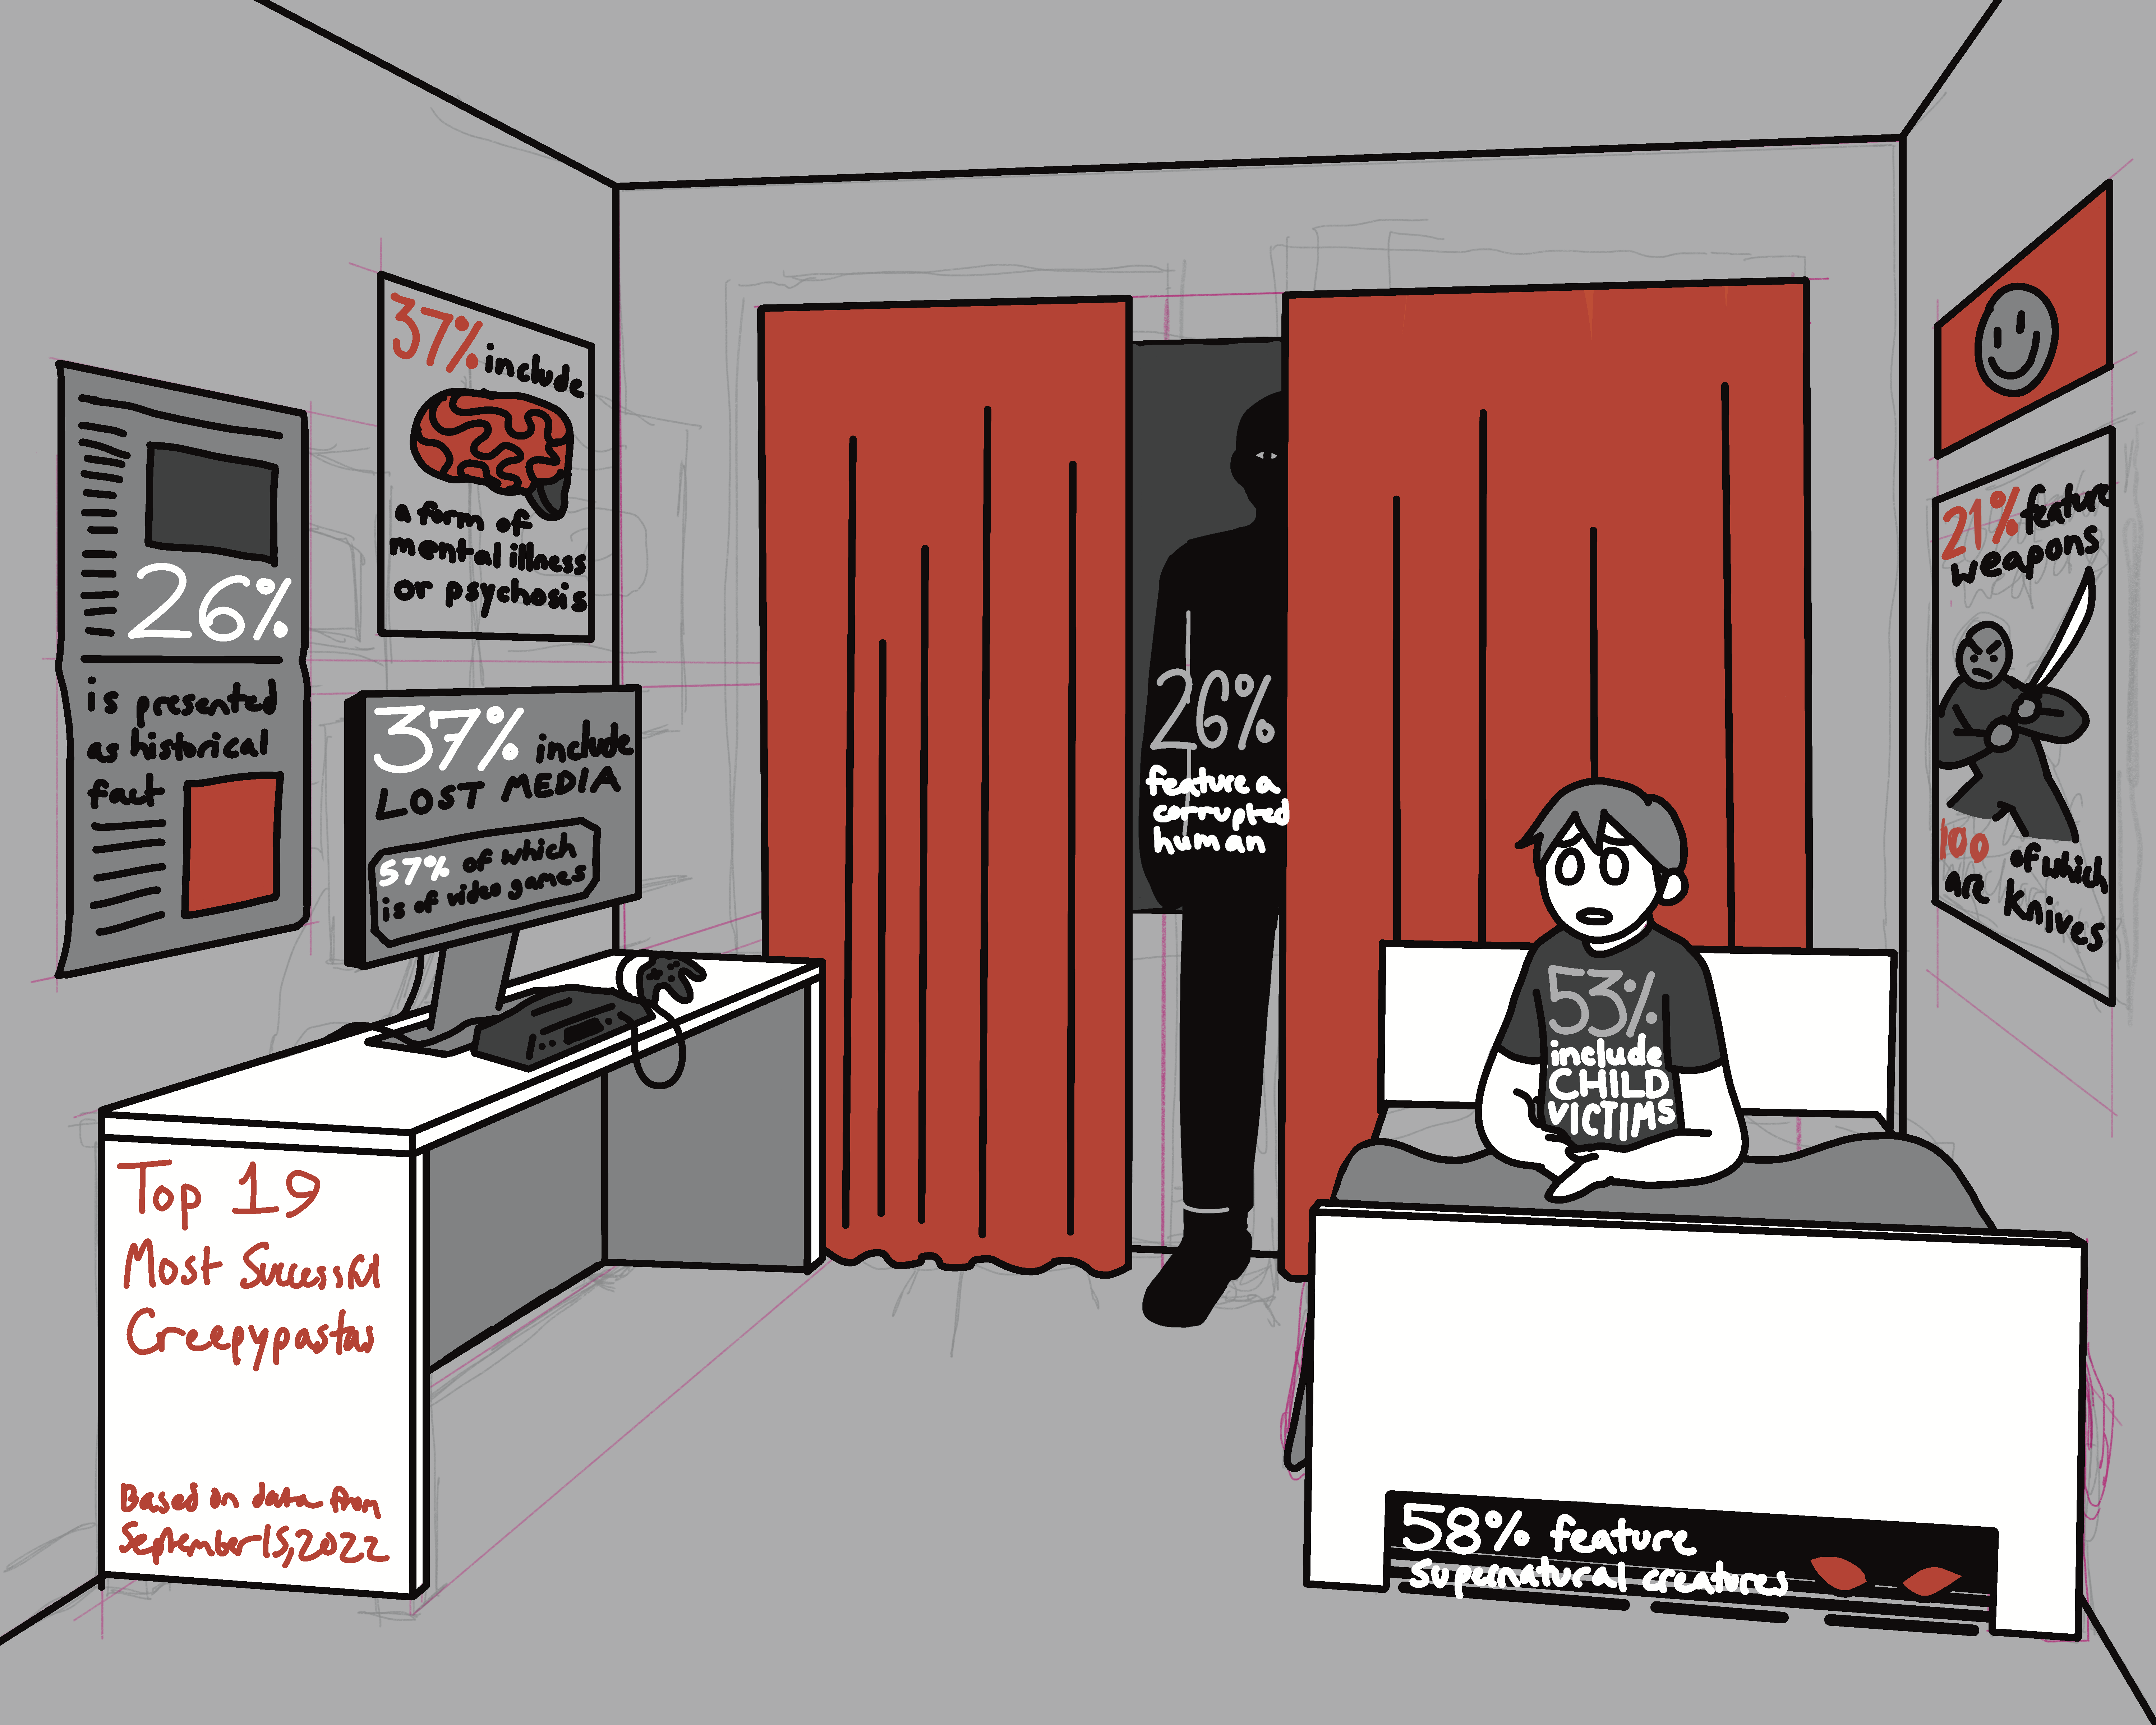
I considered the “culture” around Creepypastas and Internet horror stories. I decided to reference another related part of Internet horror for my design: scary stories animated.
If you don't know what “scary stories animated” videos are, they're basically that: scary stories people post on websites like Reddit, and which an individual or team voice over and animate to post on YouTube. There are a multitude of YouTube accounts dedicated to these videos, so I would suggest searching it on YouTube to see what I'm talking about.
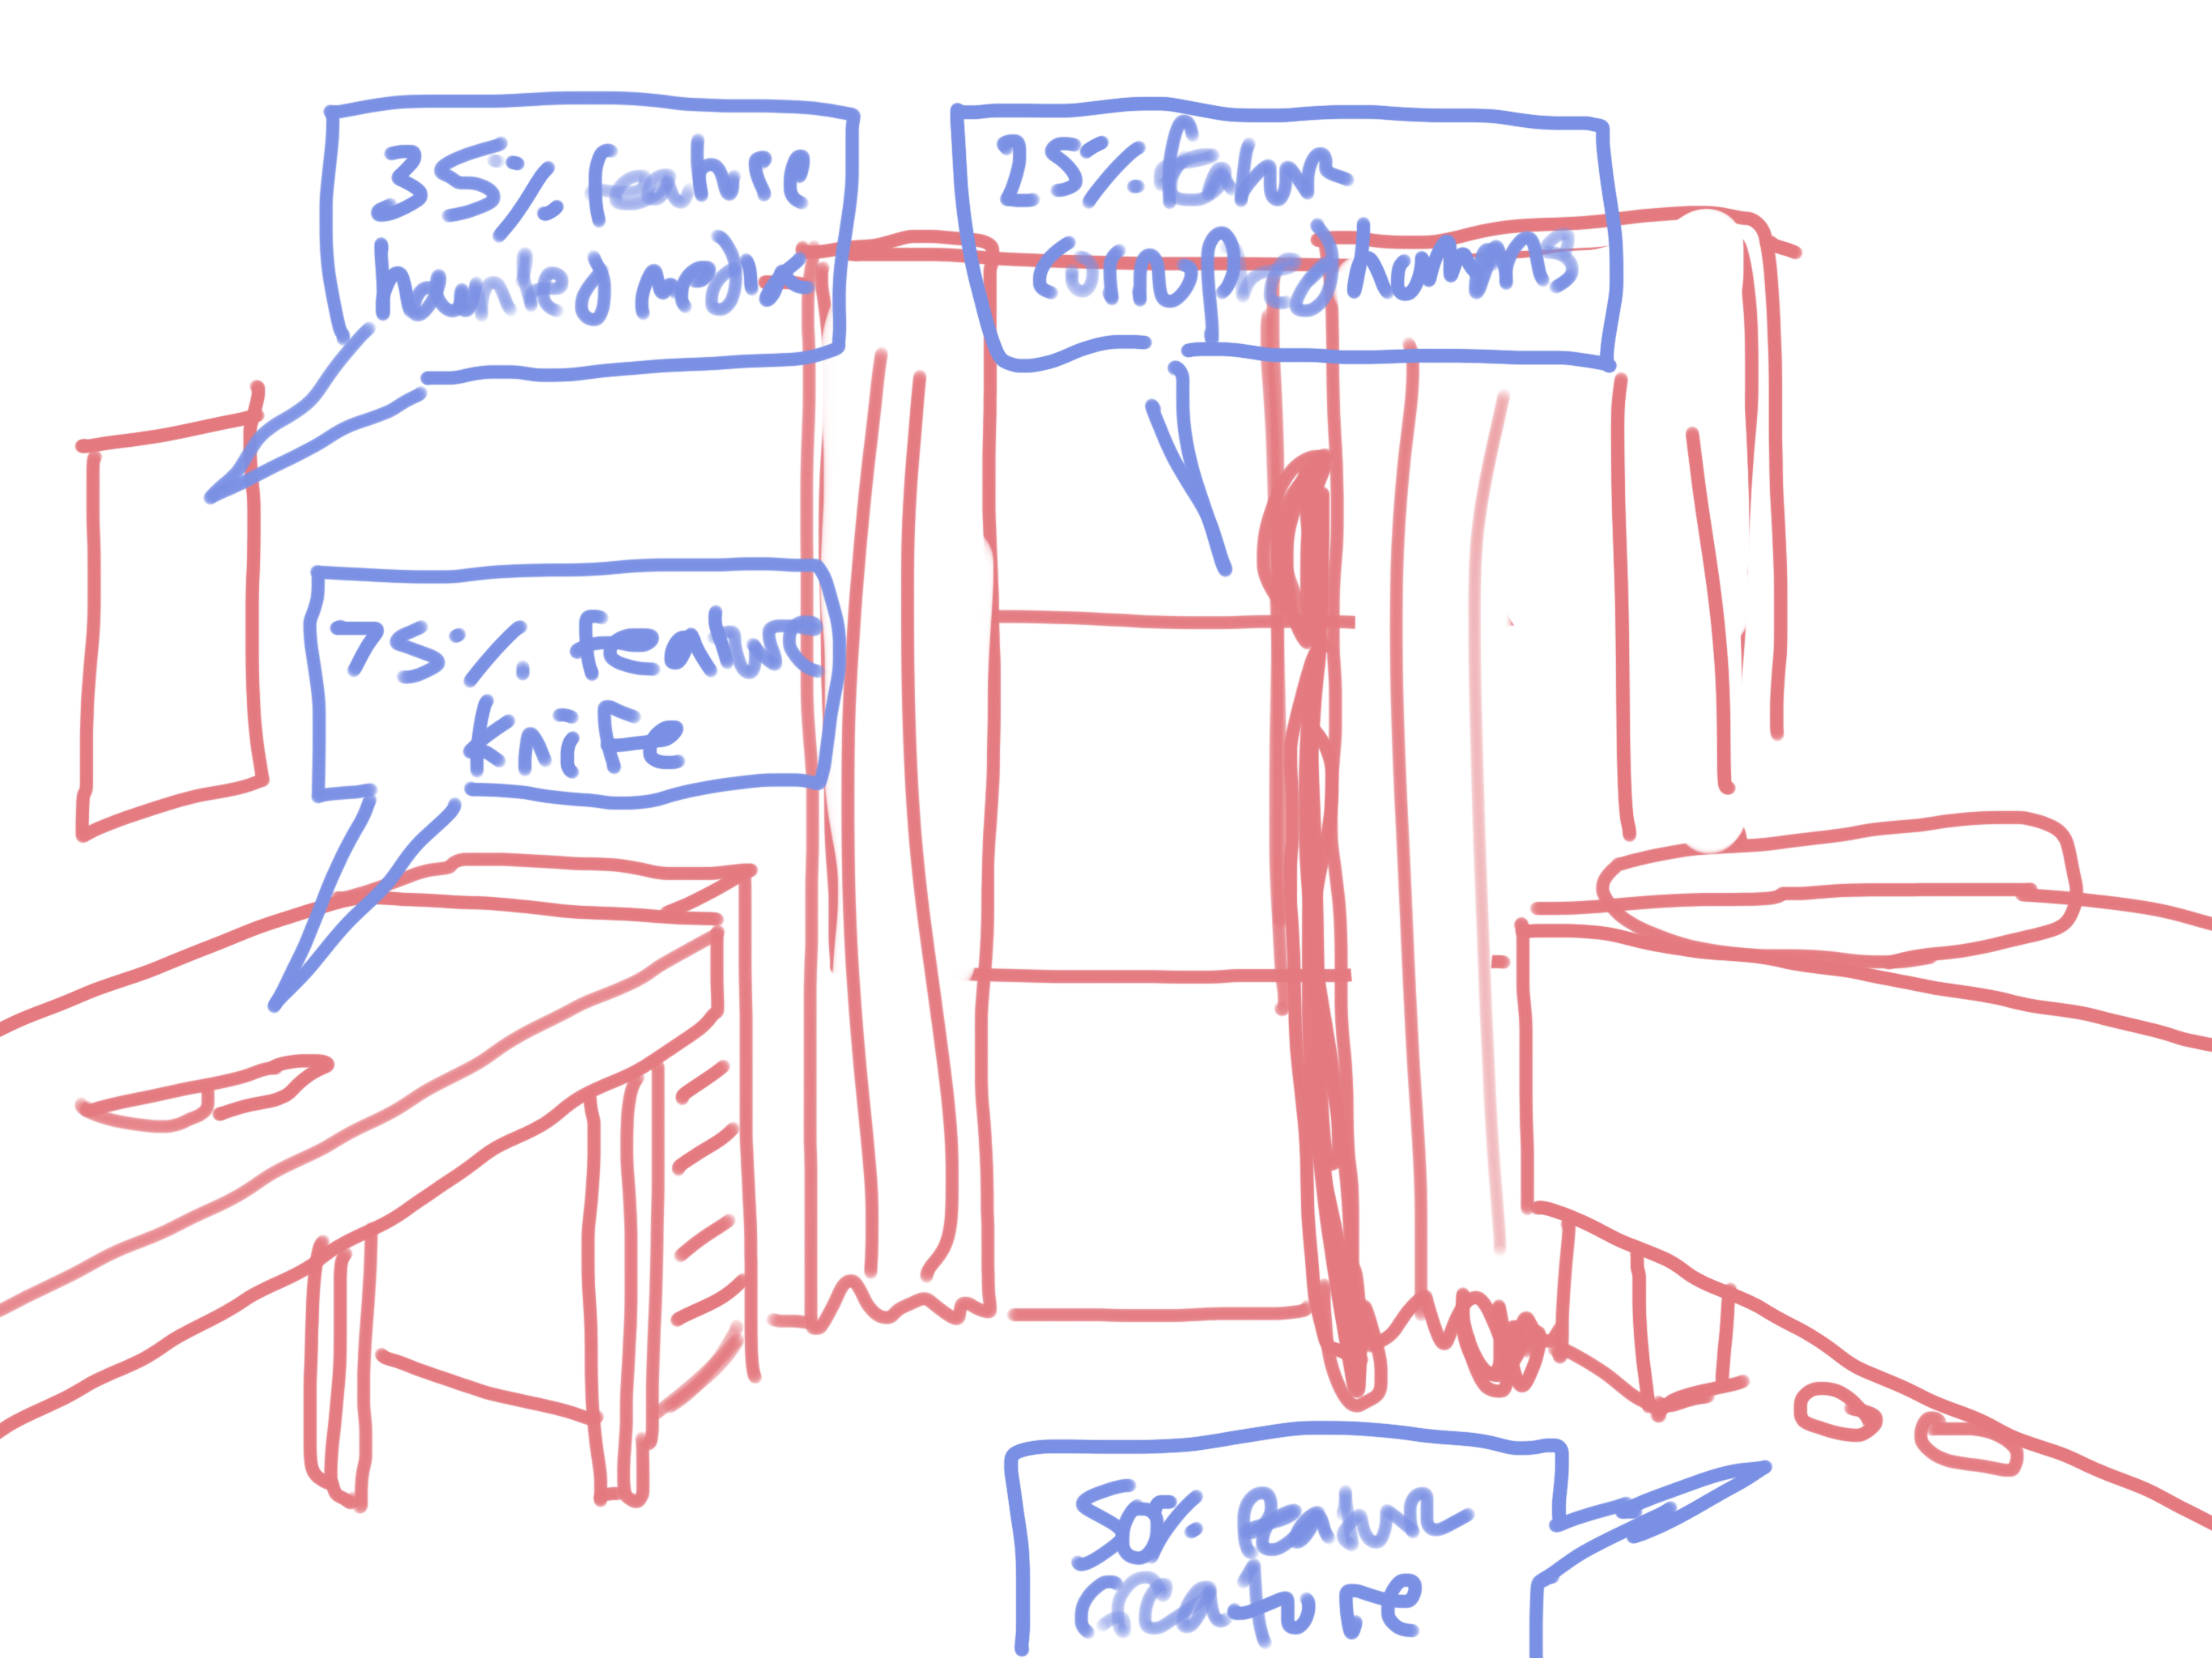
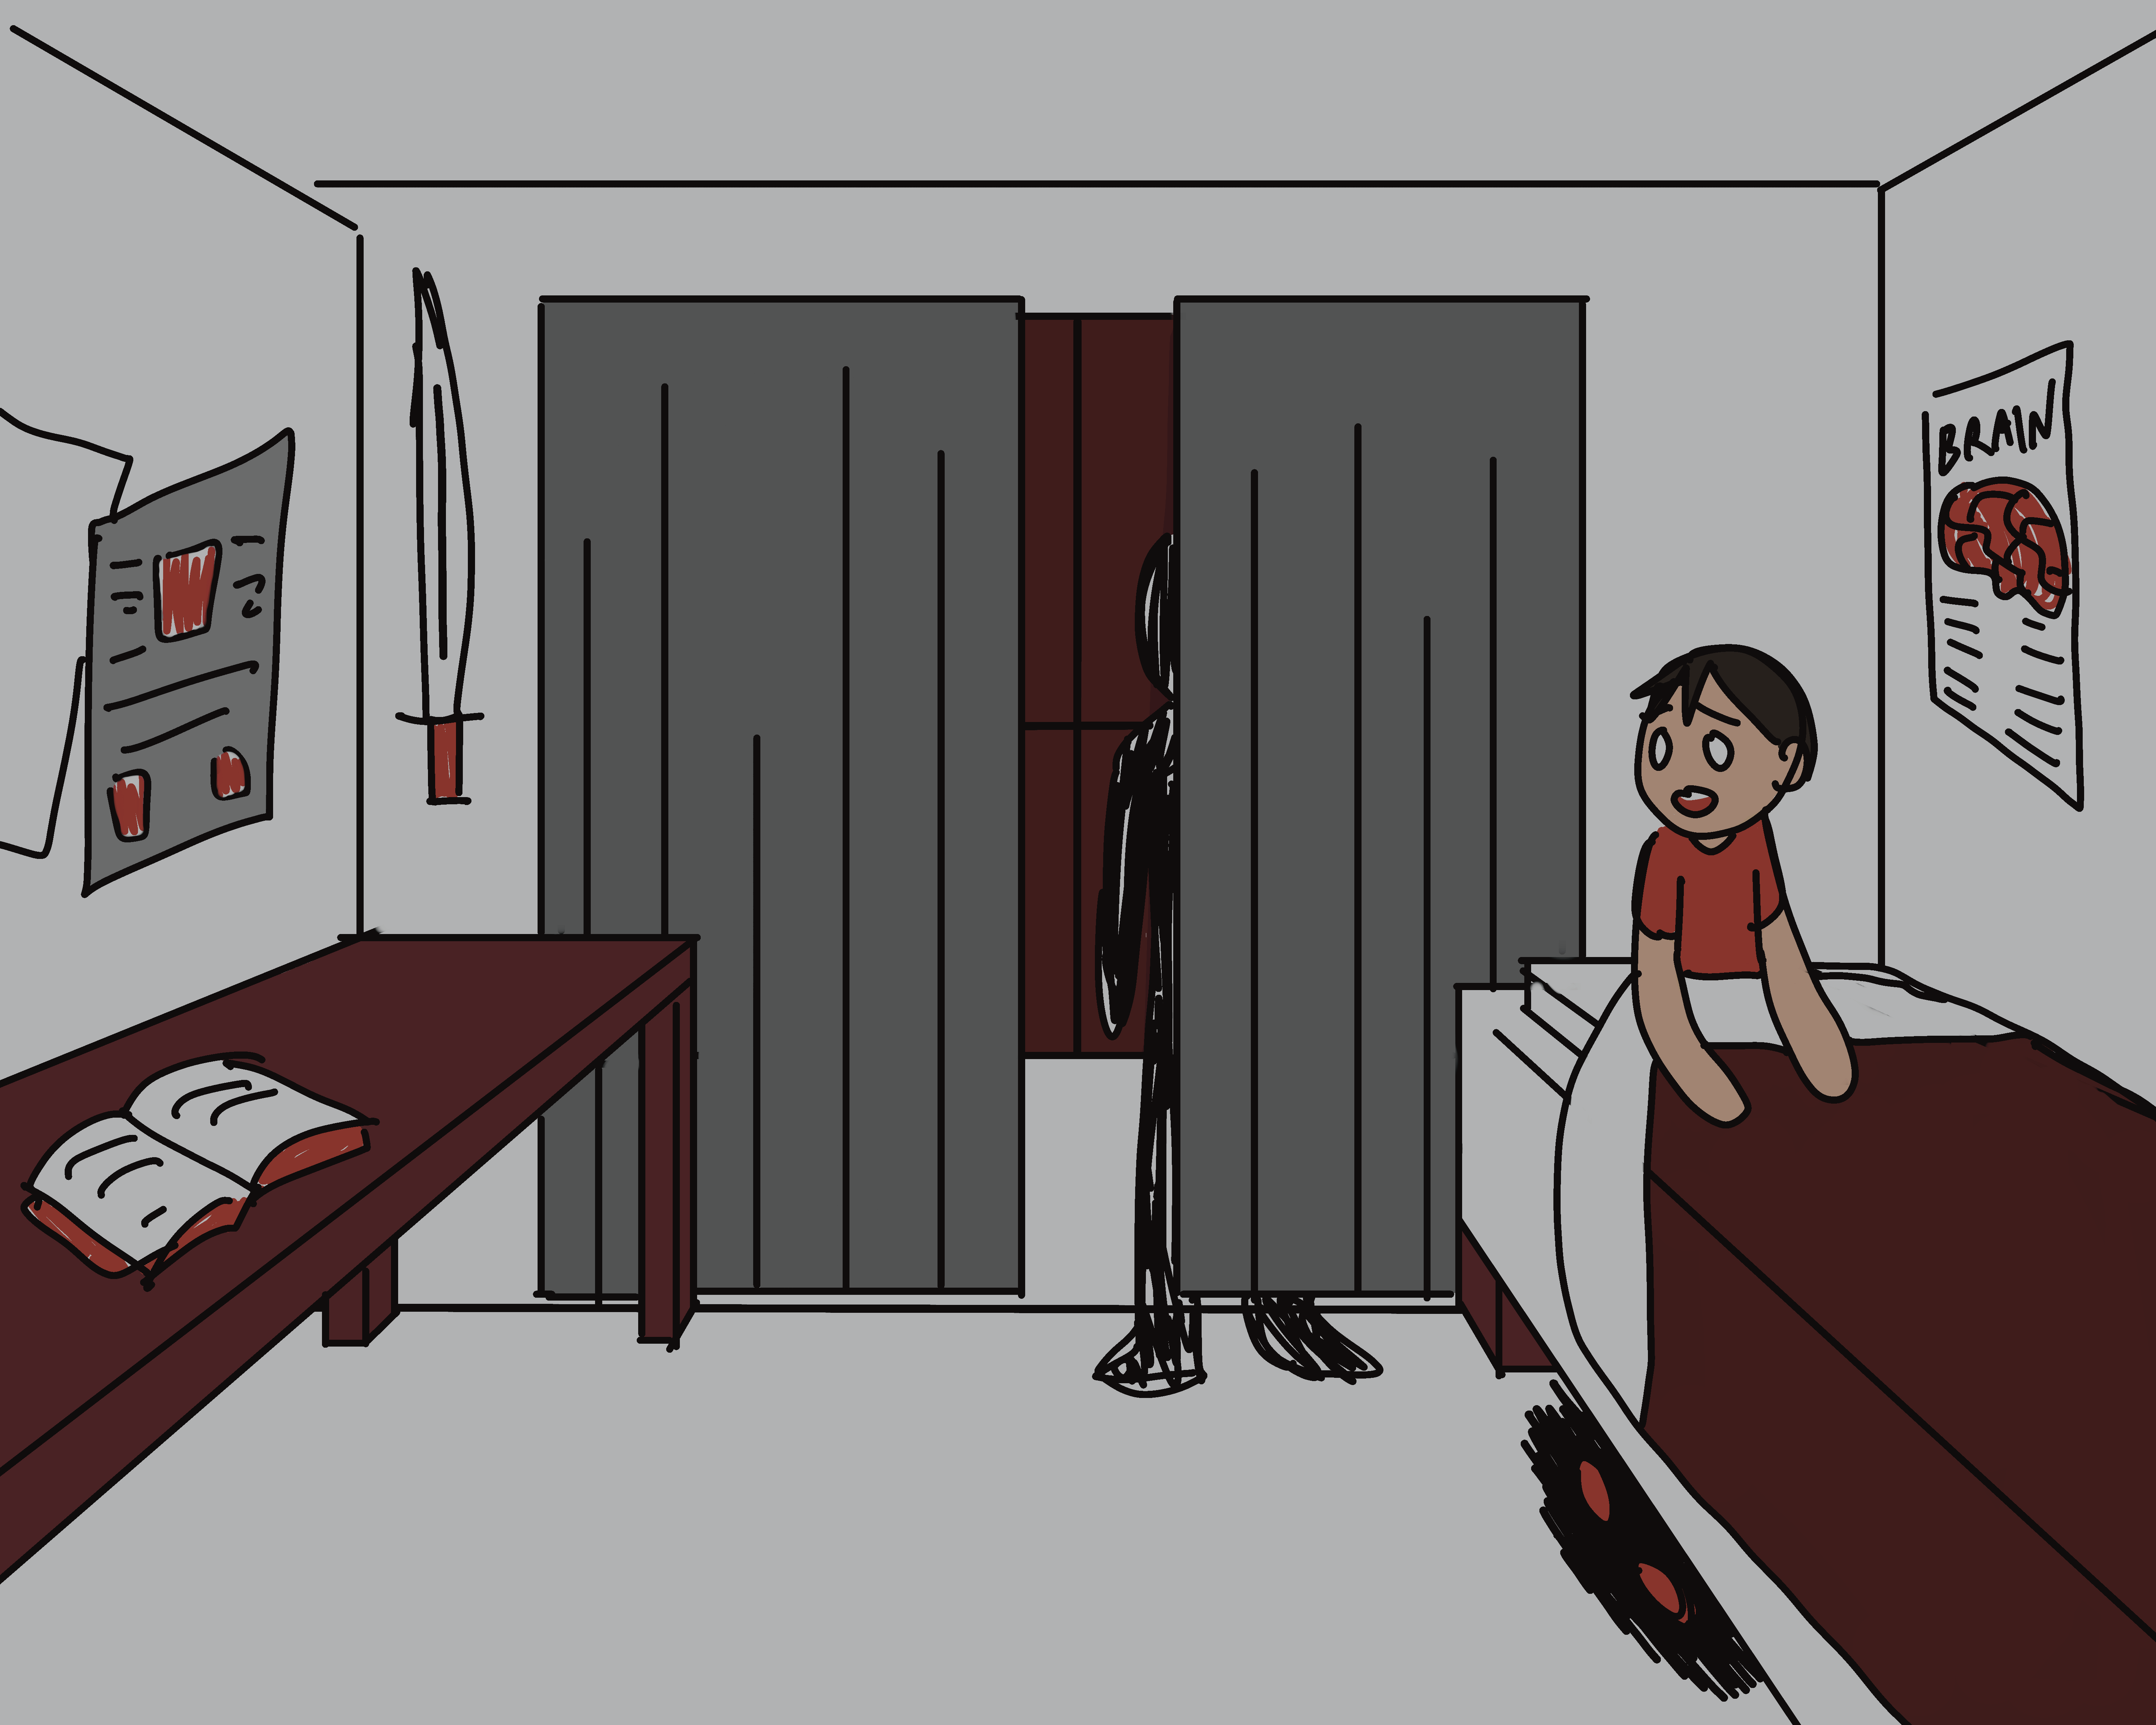
The most common setting in “scary stories animated” videos is bedrooms. Every “ingredient” I collected data on could be visualized in a bedroom. This worked perfectly, so I decided to do an illustration to connect to the culture, and I inserted data in a way that was simple to understand.